
Every tech entrepreneur dreams about making a product that goes viral, but true virality is as rare as a unicorn and poorly understood. A proper understanding of the viral coefficient, 
I’m going to distinguish different types of virality and go into detail about the various ways to model it. I’m also going to introduce the idea of “pre-virality” and why it shouldn’t be discounted. The stakes are high, viral growth means companies literally don’t need to spend a penny on marketing, and yet achieve explosive popularity and success. However, unless you have a maths background, virality can be quite counter-intuitive. (Beware, this article contains equations!)
My experience of viral growth
I’m no stranger to virality. I’ve been watching and playing with viral experiments since 1999. I’ve witnessed abject failures as well surprising successes. My interest began with setting up an experimental R&D team within moonfruit.com (a dotcom started by my two besties from Imperial, Wendy and Eirik). My team built intelligent agents to help people discover the web by learning how and what they searched for. The agent project never came to light (funding was pulled), but, on the way, we released two interactive desktop toys to test out some of the cool tech that we were building, and thought they would be good viral branding experiments. Neither went viral, instead they both quickly died out upon release. That was the end of that. A few years later, I noticed that suddenly everyone, it seemed, was inviting me by email to sign up to a web service called Birthday Alarm. It was clearly going massively viral. I didn’t know it at the time, but it turned out this was the brainchild of one of my physics classmates from Imperial. Michael had been experimenting both systematically and persistently, and finally hit a jackpot. He went on to create and sell Ringo and then Bebo, so it was well-worth the effort. Then in 2009, Wendy masterminded a simple but ingenious Twitter competition which went so viral that at one point more than 2% of all tweets globally contained the #moonfruit hashtag. Twitter actually pulled the campaign it was so disruptive. Interestingly, copycat competitions failed to go viral. More recently, I had a surprising, albeit smaller, viral success in 2015 when an article about how to learn a language quickly that I wrote on Quora suddenly started sending so much traffic to my latest startup, Kwiziq, that we upgraded our servers to cope. It was something I’d written months before and completely forgotten about. Unbeknownst to me it had been growing slowly and then suddenly, boom!
Virality is no easy thing to achieve – and certainly comes with no guarantees – but all my experience has shown me that it is possible to approach it systematically and tip the odds in one’s favour. I decided to write this article to pull together all my own thoughts and learnings over the last sixteen years because at Kwiziq we are trying to grow as virally as possible.
The classic viral loop
This is how the classic “viral loop” is generally viewed:

Intuitively, we see that, if the average number of people invited by each user, 

For this loop then, we define the viral coefficient as:
This is a great starting point for understanding virality, but as we will see, the problem with it is that it obscures more than it reveals. As a result, it gives almost no insight into what to do increase
Viral Models
“All models are wrong,” as we physicists like to say, “but some are useful.”
How we model virality for a product depends very much upon when and how people can and do share it or invite their network. Models are idealisations and therefore always wrong in some way, but they have two very important roles to play in a startup:
- They can help predict growth, but more importantly :-
- They give us insights that can guide product and process design
So the choice of model is rather important. There are two popular models which display very different behaviour and yet both mathematically model the same loop.
The Steady Sharing Model
The simplest model (often the starting point for more sophisticated models used by viral blogger Andrew Chen) bases growth on the idea that user base will always bring in a proportion, 
Note that we don’t actually need to know what the viral cycle length is, but we’ll see how important it is later.
If we start with a number of users, 


where

e.g. if 

The number of users after an arbitrary time,


This formula acts exactly the same as compound interest on a principle amount. So long as 
If we ignore network saturation for now – i.e. if we assume that for the first twenty cycles we still have plenty of room to grow – then Steady Sharing looks like this for varying values of

At very low values, there’s minimal contribution to growth. Effects like this would easily be masked by any inbound or paid marketing channels. As
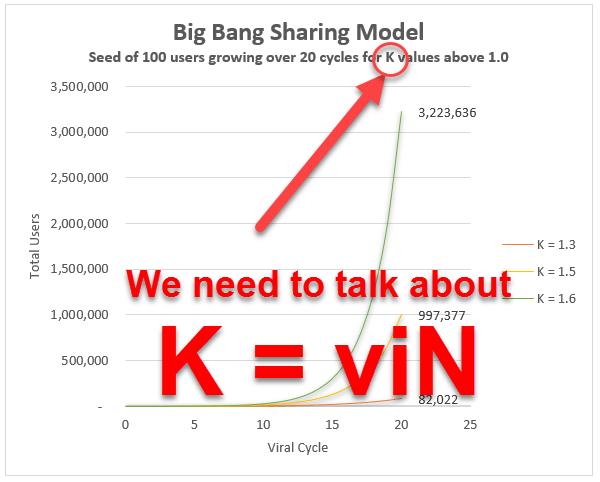
The Big Bang Theory
David Skok proposes a replacement model for Steady Sharing which I call the “Big Bang” viral model. In this model new customers invite / share to all the people in their circle of influence all in one go in the first loop of the cycle but then stop. The formula for growth in this model is slightly more complex, and 
If we start with a number of users,
bringing the total users to 
(Note that
Since only new users bring new growth, the equation for the number of users after time

(if you’re curious why it’s that, there’s a nice derivation here).
At large values for

A
Models versus reality
So, which of these models is true?
Neither. And both.
Skok claims the Steady Sharing Model is wrong, but it’s no more wrong than any other model. Which model is more accurate and applicable depends on the type of product, the user behaviour, and how sharing is enabled. Indeed, it’s possible for one, both or neither to apply.
Some products naturally support steady sharing – indeed multiple opportunities for users to share to the same people: content-based products like YouTube, for example. Others encourage Big Bang invites of entire contacts list, all in one go.
The Big Bang model is a very good fit for one-offs: articles, books, songs, videos etc. – things that people experience once and where there’s an immediate desire and opportunity to share but little incentive to return after. It’s also a good fit for products that haven’t achieved strong stickiness yet or where only one opportunity to invite people is given.
How do these models match reality though?
Learning from real examples
I don’t have enough data or insight for the moonfruit competition or Birthday Alarm, so I’ll pick two of my own examples.
Example #1 Desktop Toys
These were simple .exe files that we sent to a seed base of users – by email – and tracked the spread via code in them that pinged our servers when they were activated. They pretty much followed exactly the Big Bang model with a
We were disappointed naturally, but if I knew then what I knew now, I’d have had a better idea of how to measure and increase
Example #2 Quora article
The Quora also went viral in very much a Big Bang way, at first anyway, only slowing when it reached saturation in the primary network – roughly a million views (reaching what Chen calls the network’s “carrying capacity”).
However, the growth didn’t slow to zero as predicted by Big Bang.
In fact, it went pretty linear and still garners about 5-6k views a month which I’m more than happy with as it generally keeps me top of this list and continues to drive traffic to Kwiziq. In reality, it didn’t follow either model closely.
Why?
All models are wrong. In the real world, things are fantastically more complicated than our simple models. In reality, it’s quite likely that some users will be Steady Sharing (I know several teachers who share it ongoingly, for example), and others will Big Bang share when they encounter it; and others still who do both. It’s possible to a be a hybrid of both models.
Furthermore, and this is vital to understand, the source of new users (or readers in this case) is not limited to those generated by the sharing of the article. New readers are being brought in by Quora (internally via emails they send out highlighting popular articles, and via external search). They also get traffic from links from syndicated versions of the article such as these Huffington Post and Business Insider versions.
Neither of the models account for external sources to the viral cycle. In both though, this would add an extra boost to the number of users in any given cycle.
Finally, neither accounts for multiple sharing mechanisms.
The article gets shared by email, Facebook and Twitter as well, to name a few (Twitter being the most obvious to me as I often get an @gruffdavies mention).
So in fact, instead of one value for
The important learning from this is that, even if the sharing mechanism is Big Bang and has a
Pre-virality
If we have external sources of users (paid or inbound marketing for example), then even lower values of K than 1.0 are potentially still hugely valuable. Values between 0.5 and 1.0 are what I called pre-viral and still well worth attaining, because each user then multiplies into more, even though the effect is self-limiting:
| K value | Multiplying Effect |
| 0.5 | 200% |
| 0.7 | 333% |
| 0.8 | 495% |
| 0.9 | 891% |
Using models as a guide to design
Models aren’t just good for telling us how a product or service might spread, but can guide our tactics and strategies underpinning growth. They can and should guide product and process decisions.
It’s clear that non-viral sources of acquisition should not be overlooked. Any web-based service is going to have SEO and paid marketing channels – and these channels can help to continuously feed viral growth mechanisms even when the K values are low. It’s also clear that, if possible, steady sharing mechanisms are going to have a huge benefit in the long-term.
There are obvious major learnings to be had immediately from these models, and a third which may be less obvious:
- Big Bang is better than Steady Sharing for high values of K, but Steady Sharing produces continual growth at low values, therefore the ideal scenario should support and encourage a hybrid of both.
- In Steady Sharing for all K, and Big Bang for
- K is actually the combined result of multiple steps of a funnel. Each step reduces K by a factor. So decompose
All this brings me to the title of this blog post.
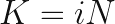
We really need to talk about K = viN
Kwiziq already supports multiple sharing mechanisms and one invitation mechanism (teachers, tutors or studygroup coordinators can invites students to join). We haven’t supported users-inviting-users yet but this is high on our agenda. However, it seemed obvious to me that, with respect to virality, because we only support one language right now, this dramatically reduces
The classic viral loop is missing a vital detail: relevance to the user. A user won’t even think about accepting an invitation unless the offer is relevant to their needs. In our case, if they aren’t learning French then they won’t consider accepting. So the viral loop really looks like this:

Only a percentage of users invited, 

Very high relevance is a key reason that Michael had such success with Birthday Alarm – everyone has a birthday and everyone has people whose birthdays they want to remember. It’s the reason moonfruit’s twitter campaign was so successful – almost everyone wanted a MacBook and the “cost” of retweeting a hashtag to have the chance win one was negligible to the user.
We estimate that a third of the world speaks another language badly (essentially our market) which puts an absolute upper limit on
We already know it’s possible to achieve virality with more languages since at least three of the major players in the language learning space grew virally to 30M – 150M users over the space of a just a few years after they started offering the most popular languages.
Analyse Feasibility: the Kevin test
The 
For Kwiziq, then, the
| Relevance | Invite Acceptance Rate |
Average Network Size |
||||
| v | i | N | = | K | ||
| ceiling : | 33% | 50% | 200 | 33 | !! | |
| est. starting : | 5% | 5% | 200 | 0.5 | pre-viral | |
| target : | 15% | 10% | 200 | 3 | hugely viral |
So, Kwiziq passes the “Kevin feasibility test”.
Detailed viral analysis
This is just the beginning of what we must do in analysing the viral loop though. It behooves us to understand every single step in the funnel, whether it’s a real step involving a physical action, or a step in the user’s decision process in their head. What we need is something reminiscent of the Drake Equation.
Here’s a an example as a starting point for a specific product viral loop, but in real life, this should be an ongoing process of identifying and optimising every possible step of attrition that can reduce 

There are fairly obviously a great deal of potential UX improvement steps between a user joining, wanting to and being easily able to invite others that will be worth careful attention.
Measure
“If you cannot measure it, you cannot improve it” – Lord Kelvin
One final piece of advice, measure everything. The minute you have a measure to track, you’ll start thinking of ways to improve it.
You may not always have direct measures (how do you measure real word-of-mouth, for example?) If, like Kwiziq, your product supports many different acquisition types and channels, and is a hybrid viral model, then you need to look for indirect measures that will indicate when they are working.
I would suggest you track something like the ratio of New Paying Users to New Registrations per week/month. This is especially revealing because paying users will contain most of your “sneezers” (they like your product enough to pay for it, right?). New users coming though viral channels will start to make this metric rise non-linearly at the beginning (it will eventually become asymptotic towards 100% if viral takes over). Your efforts to improve UX and address anything that’s reducing

NB: you will need to understand and analyse any other mechanisms that can cause non-linearity here to be sure, but over time, a metric like this ought to detect viral growth well before it becomes visible in your overall acquisition metrics.
Good luck!
P.S. The flow diagrams in this blog post were created in seconds using Pidgin.

The contrast between the failed desktop toys and Birthday Alarm’s eventual success really sticks—it shows how systematic experimentation, not just luck, often separates viral hits from duds. Having tried similar small-scale experiments myself, the frustration of watching something flop is familiar, but it’s encouraging to see persistence pay off.
LikeLike